
P value is a key concept to analyzing data. It helps in determining the significance of the results which are obtained from correlation or regression analysis.
Since calculating the value manually is a daunting task and it increases the probability of errors, hence other ways allow us to calculate the P value, simply. So here in this article, we will learn about the easy ways to calculate the P value in Excel by using built-in formulas and functions.
Defining P Value And Ways To Measure It
P value is used for performing the hypothesis testing and indicates how a value might be statistically significant. It helps to check whether the null hypothesis is valid or invalid and it uses the range 0 to 1 to measure it.
When the P value is low, the chances of invalidity of the null hypothesis are high. When the P value is higher, the chances of invalidity of the null hypothesis will be lesser.
- Significance: It is the measured difference between the actual outcome and the expected outcome in statistics.
- Null Hypothesis: It is the default hypothesis claim which says that there is null variation between the measured data and the expected outcome.
- Alternative Hypothesis: This is the hypothesis that is given to show the statistical difference between the observed results and the expected results.
The importance of the P value is measured on three levels. These are:
- Significant: When the P value range equals or less than 5% or 0.05.
- Marginally Significant: When the P value ranges between 5% to 10%.
- Insignificant: If the P value is more than 10% or 0.10.
Formulas Used For Calculating P-Value
To calculate the value in Excel two formulas are used: TDIST and TTEST. Here is an overview of the formulas.
TDIST
TDIST helps in calculating the one-tailed probability of the student’s t distribution. This formula is used in hypothesis testing to check whether a sample mean is significantly different from the population mean; it contains three arguments – the test value (x), degrees of freedom, and the number of tails in the distribution (tails).
- x is a numeric value that helps in evaluation.
- The degree of freedom is the integer for the degrees of freedom.
- Tails help in specifying the total number of distributed tails. One means one-tailed and two means two-tailed.
Syntax: TDIST(x, degrees_freedom, tails)
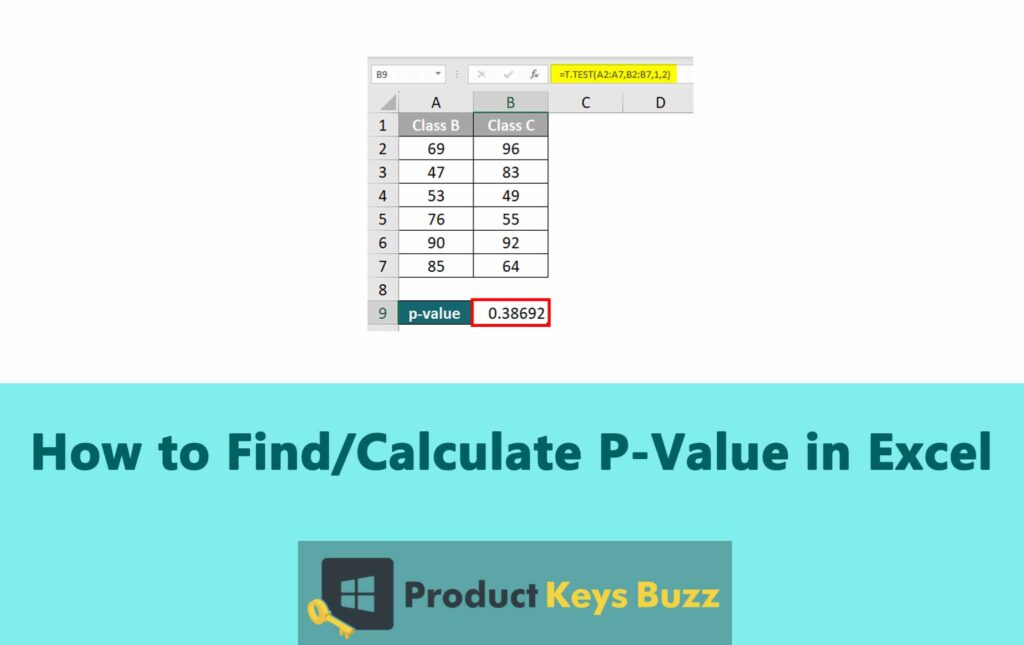
TTEST
This formula calculates the probability that the two samples are taken from the same population. This assumption is based on how the samples are normally distributed and have equal variances.
This formula takes four arguments: the first data set (array1), the second data set (array2), the number of tails present in the distribution (tails), and the specific type of t-test that needs to be performed (type).
Syntax: TTEST(array1, array2, tails, type)
Methods to calculate P value in Excel with TDIST function
To conduct any statistical hypothesis or test, the P value is a crucial factor. In Excel, you can find several methods that help to calculate the P value, but one of the most essential ones is the TDIST function. Here are the ways of calculating the P value by using the TDIST function of excel.
Method 1: Use The Insert Function Button
- Select the cell where you want to calculate the P value
- In the formula bar, you will find the fx button. It will help to open the insert function dialogue box

- Go to the search bar and type TDIST. Select the TDIST option from the list of functions
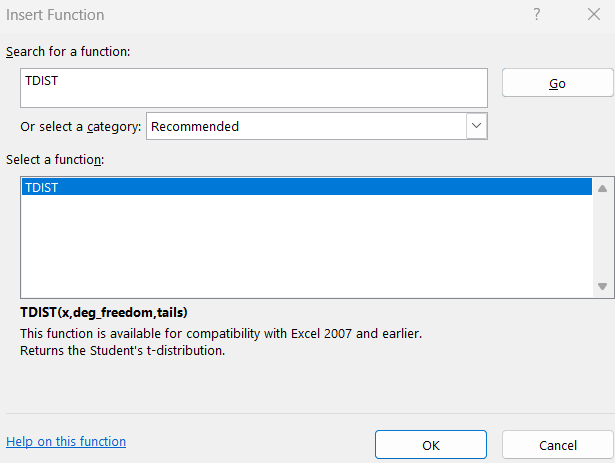
- Provide the appropriate values for the respective arguments present in the function argument dialogue box
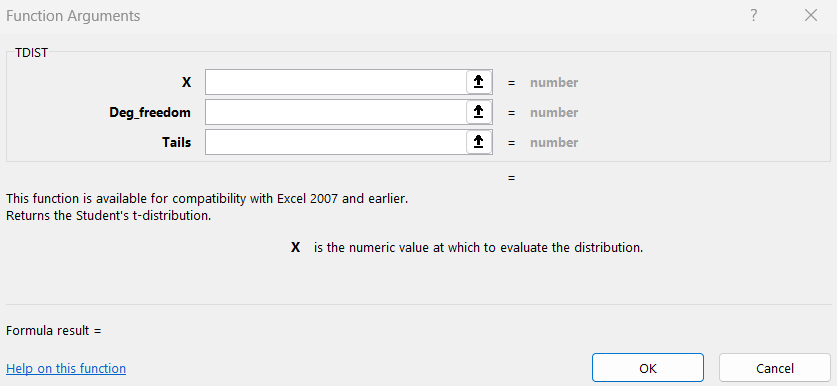
- Click on OK and it will close that dialogue box and provide the calculated P value
Method 2: Use The Statistical Formula Section
- Click on the cell, where you want to calculate the P value
- You will find the Formulas tab in the ribbon

- From the drop-down menu of More Functions, you need to select the option Satistical.

- From the list, click on the function TDIST.

- Provide the values of the argument in the function arguments dialogue box.
- Click OK and it will close the dialogue box and provide the calculated P value.
Method 3: Manually Enter The P Value Formulas
If you feel that you have decent expertise in using Excel sheets, then you can also try to manually use the formula of TDIST to calculate the p-value. When you enter the formula manually, it is much more straightforward and saves a lot of hassle. But if you make any slightest typo, it can cause errors. So here is how you can calculate the P value manually in excel.
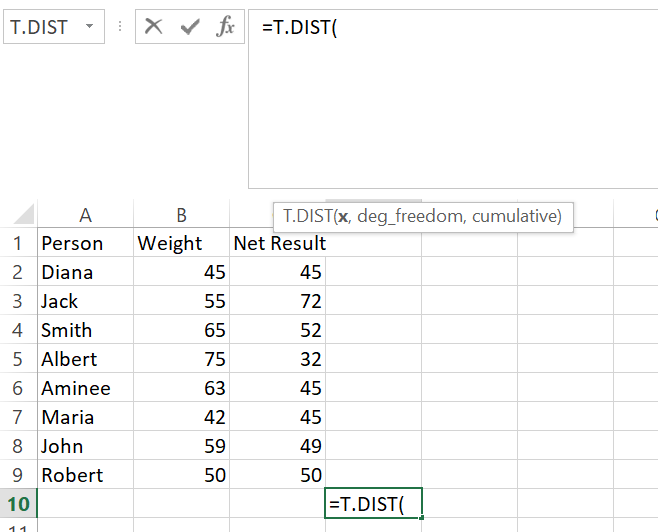
- Open Excel with the data where you want to conduct a hypothesis test and click on the cell where you want to calculate the P value.
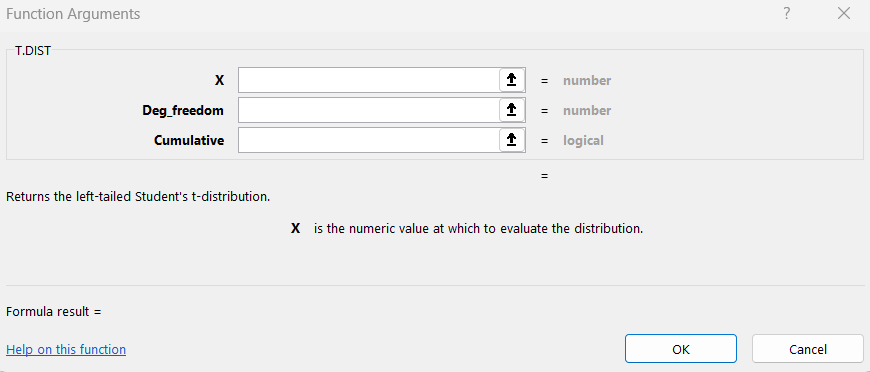
- Above the cells, you will find the fx tab. There you have to provide the TDIST formula= T.DIST(x, deg_freedom, tails). You have to replace the deg_freedom, x, and tails with cell numbers like B2, B9, and B12. Now, you have to click on the ENTER button to calculate the P value.
Methods to calculate P value in Excel with TTEST function
The methods for applying the TTEST and TDIST functions in excel may look similar, but they each demand different arguments. Here are the three methods that are used for calculating the P value by using the TTEST function in excel.
Method 1: Use The Insert Function Button
Click on the cell, where you want to place the P value result
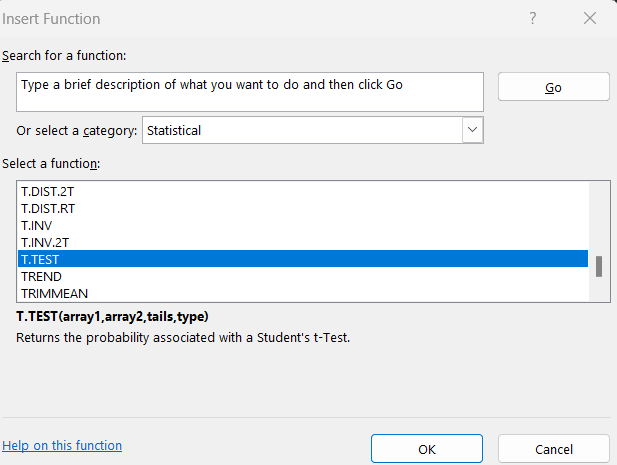
- In the formula bar, you have to click on the fx button

- Look for the function TTEST and select it
- Provide the arguments for the function, which includes the data array and the type of test that you want to perform
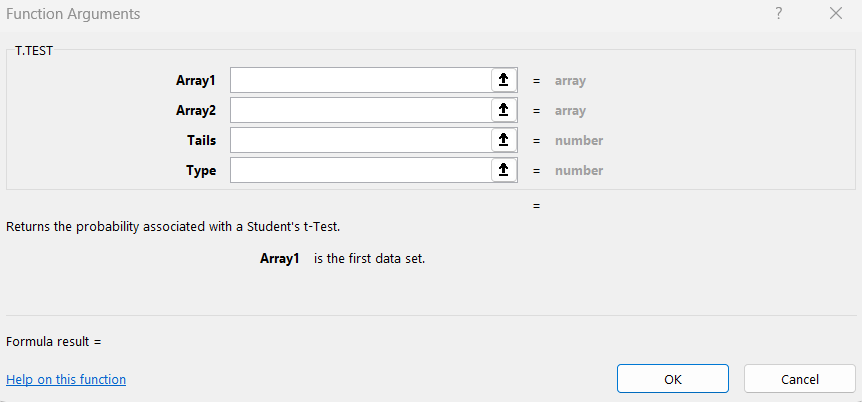
- Click OK to see the result
Method 2: Use The Statistical Formula Section
- Click on the cell, where you want to place the P value result
- In the ribbon, you can find the Formulas tab

- Click on the option, More Functions, and from there select option Statistical.

- Choose the function TTEST

- Provide the arguments needed for the function, and then proceed by clicking OK to check the result
Method 3: Manually Enter The P Value Formulas
One can manually enter the formula of the TTEST function in excel to calculate the P value. When you’re using this method, it can provide some errors and if there is any typo in the formula of the function, it can also provide a false outcome. So it is important to use this method with caution. Here is how you can calculate the P value in excel manually.
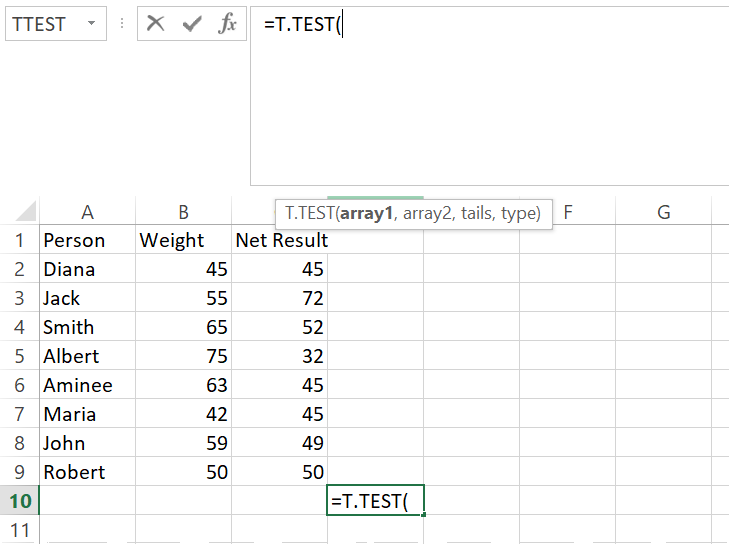
- Open Excel with the data where you want to conduct the hypothesis. Click on the cell where you want to calculate the P value.
- In the fx tab present above the cell, you have to enter the formula of TTEST, that is, TTEST (array1, array2, tails, type). Now you have to replace the array1, array2, tails, and type with the cell numbers that are B3, B6, B9, and so on. You have to enter the key to calculate the P value.
Sometimes it can be time-consuming and challenging to calculate the values manually. Hence, excel comes with powerful automated tools to ease the process. However, you have to keep in mind multiple factors before making the calculation. By using the above two functions, much of the hard work will be cut down.
Final Words
We have discussed how to calculate the P value in Excel by using the TTEST and TDIST functions. P value is a key statistical tool that helps in testing hypotheses and also determines the significance of results. By calculating the P value, one can drastically improve efficiency when it comes to dealing with statistically heavy tasks.
Table of Contents